If I had asked my customers what they wanted, they would have said a faster horse. Henry Ford
Percentile ranks on student reports are tests as contests.
Raw scores on student reports are like live chickens on dinner plates.
If I were to step on my bathroom scale and see a single number like, say for example, 165 lbs (or 75 kilo) with no further explanation, I wouldn’t need an interpretation guide or course in psychometrics to know what the number means or to decide if I like it or not. Nor would I be writing to the manufacturer of the scale asking, “What’s a pound?” If I were to take a qualifying test to be a licensed dog walker and I received a postcard in the mail that said simply, “Your score is 509 GRits ± 41,” I would be a little frustrated and a lot annoyed. And I would need to ask some basic questions like, “What does that mean?” “What’s a GRit?” “Is the ‘41’ the standard error of measurement, or does it represent a confidence interval?” “If so, what level of confidence?” “What does 509 actually say about my proficiency to walk dogs?” And, of course, “Did I pass?”
If the answer to the last question is yes, then most candidates, possibly excluding the psychometricians, will quickly lose interest in the others. If the answer is no, then the tone becomes a little more strident and now includes questions like, “Who decides what passing is?” “What did I miss?” “How close was I?” and if I was close, “Isn’t there almost a 50% chance that I actually passed?”[1] People who did pass never seem concerned about the other half of this question.
If a postcard with a Scale Score (even with some form of the standard error of measurement) isn’t useful or meaningful, what does a report need to be? Examinee reports vary depending on the audience and the purpose of the exam, but for a report going to a student, teacher, parent, or anyone else who might actually make use of the information for the betterment of the examinee, there would seem to be four basic components:
- Identification
- Measurement
- Control
- Interpretation
There needs to be enough identifying information to locate the examinee and to deliver the report to the right place. For dog walking candidates, the address on the front of the postcard did the trick. For education, it probably takes some combination of student name, teacher name, classroom /section/period, grade, school, and district. We should also mention the name of the test and the date taken. That is almost always more than enough to locate the right person; if you are still worried about it, add birth date or a parent’s name. Our original list should be adequate to locate the teacher and the teacher should know the student by name.
Measurement of the examinee to determine something about status or progress is the point of the exercise. This report section could be the simple “509 GRits” but it should also include some indication of our confidence in this measurement, which means the standard error of measurement in some guise. To make it concrete, in this example, the standard error of measurement is 41, with a 95% confidence interval of 509 ± 82, or 427 to 591. It is probably prudent to never use a phrase involving the word “error” when communicating with parents or school boards; they tend to interpret “error” as “mistake” and blame you. One often sees phrases like “probable range” to describe the interval between the measure plus and minus two standard errors (or some other arbitrary multiplier), which avoids saying ‘error’ and also ducks the squabble between the frequentists and the Bayesians about what confidence means. A picture may not be worth a thousand words in this case but here it is.
I am inclined to leave it at that for the moment but not everyone thinks a line with scale scores and a marker for the person’s location is all that informative. I am oft over-ridden to add other (useful and relevant) information like a conclusion (e.g., pass/fail or performance level[2]) and sometimes even subtest measures to the measurement section. One could also say things like a person at 509 has 41% likelihood of testing below the Competent level next time and a 1e-6 likelihood of testing above Skilled. These are really steps toward control and interpretation not measurement so the purist in me wants to put them in the next two sections. Although it’s not worth falling on my sword and what goes in what section is less rigid than I seem to be implying.
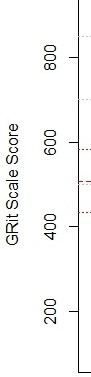
I am willing to give some meaning to the score by showing the ruler and some milestones along it. At this point, the scale score may be less meaningful than the milestones, but with experience, the scale score can become a useful shorthand for the milestones. It doesn’t take very much experience to understand what temperatures of 0°C and 37°C imply, even for US residents. This leads me to the less simple “map” below.
Diagnosis With the Model
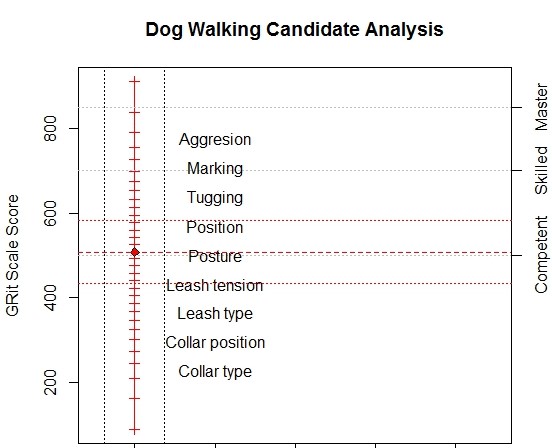
The vertical scale is GRits[3], which is our measure of dog walking proficiency and almost meaningless by itself; we wouldn’t lose much if we left the numbers off entirely[4]. The column of text labels is the substantive description of the scale. Topics at the low end, which are relatively easy, deal with type and use of basic equipment; topics at the high end, which are more difficult, deal with complex behaviors. The GRits bring precision; the text labels bring meaning.
The red vertical line has a tic mark for each possible raw score and a red diamond to mark the location of our hypothetical person. The red horizontal lines are the person’s location and plus/minus two standard errors. You can also add some normative information like means, standard deviations, frequency distributions, or quantiles, if you are into that sort of thing.
The gray horizontal lines mark the performance levels: 500 is Competent, 700 is Skilled, and 850 is Master. Labelling the lines rather than the regions between is not standard practice in educational assessment but it avoids the inconvenience of needing to label the region below Competent and the misinterpretation of the levels as actual developmental states or stages rather than simply more or less arbitrary criteria for addressing school accountability or dispensing certificates. So far we are just displaying the result, not interpreting it.
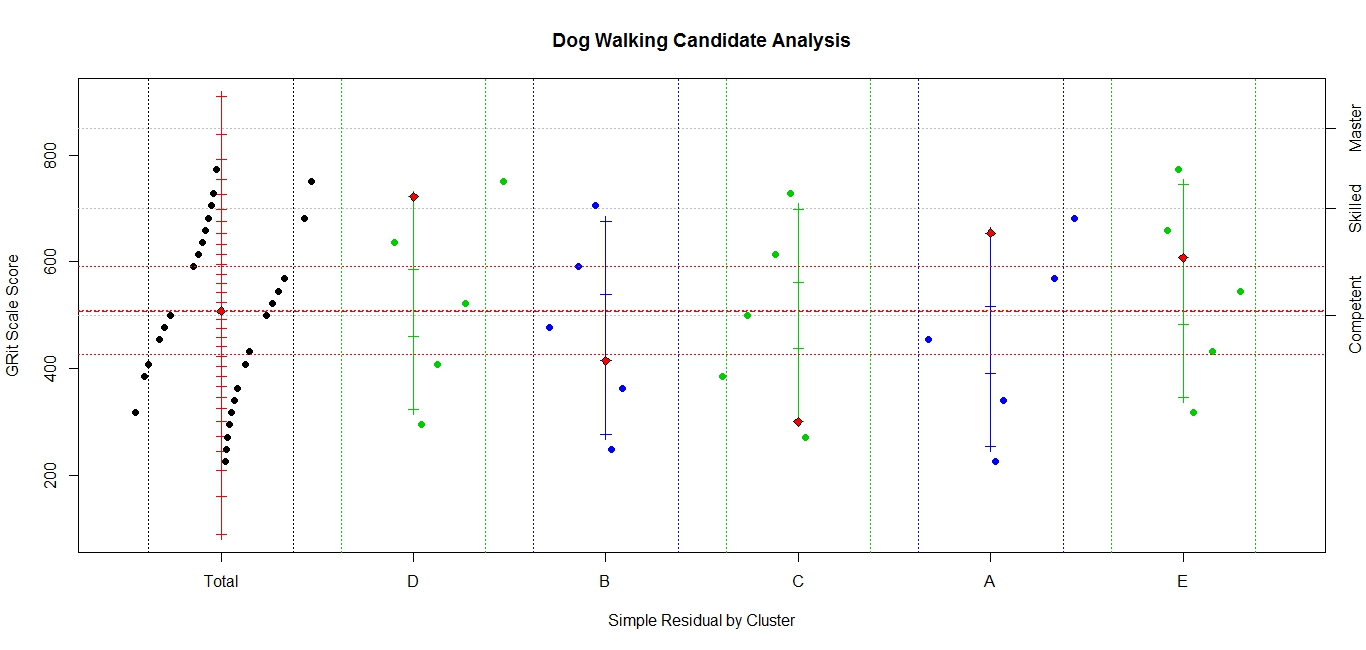
Control of the measurement model means, either, ensuring that we are warranted in treating the result as a valid measure, in the full sense of the word as we just did, or diagnosing what the anomalies tell us about the examinee. This is again the dichotomy of “diagnosing with the model” and “diagnosing from the model.” Determining which of these paths to follow requires a bit more than simply computing ‘infit’ or ‘outfit’ and consulting the appropriate table of big numbers. This involves looking at individual items, splitting the items into clusters, and looking for things that are funny. Maps like the following can be more useful than any fit statistic and almost number-free.
Diagnosis From the Model
The display has the same measurement information as before and considerable detail about items and item clusters. First, the red vertical line still refers to the total test and still has a tic mark for each possible raw score and the red diamond for the person. It now has a black diamond for each item response; items to the left of the line are incorrect; those to the right are correct with the distance from the line representing the probability against the response; the greater the distance, the more improbable the response. The dotted vertical lines (blue shading) are control lines and represent probabilities of 75%. We don’t need to be much concerned about anything in the blue. There are four or five items, two difficult items passed and two or three easy items missed, outside the control lines that might warrant investigation.
Most of the same information has been added for each of five item clusters. These are very short tests so the results may seem a little erratic but in all cases, one more item right or wrong would bring them close to the total test measure. If you are so inclined, the number correct score can be found by counting the tic marks[5] up to the red diamond. You can’t necessarily find it by counting the item plotting symbols to the right of the scales because they can represent multiple items. (And it is further confused because some items were not assigned to clusters.) Overall, this is a well-behaved person.
Because I often disparage anything short of computer-administered, fully adaptive tests (CAT), I need to point out a serious issue for me and model control: in the world of CAT, there are no surprises. If we do the CAT right, everything should be in the blue bands. This puts all the load for model control on the item clusters. In our example, we have behaved as though clusters were based on content, which is appropriate for reporting. For control, we would do more by forming clusters based on difficulty, sequence, item type, item format, and item exposure or age are natural choices but as we become more creative in developing items for computer administration, there could be others.
Interpretation of the measure means explaining what the measurement tells us about the status and progress of the examinee. Establishing ‘performance levels,’ say, Master, Skilled, or Competent dog walker, is a significant step from measurement to meaning, or from quantification to qualification. Announcing that the candidate is above, say, the ‘Competent’ performance level is a start. Diagnosis with the model would then talk about what items candidates at this level have mastery of, what items they have no clue about, and what items are at the candidate’s level. This is reporting what the candidate can do, what the candidate can’t do, and what the candidate should find challenging but possible. That suggests three obvious comments that any computer could readily generate as personalized feedback assuming a well-behaved response pattern and diagnosis with the model.
Personalizing a report takes more than generating text that restates the obvious and uses the candidate’s name in a complete sentence, like “Ron, your Dog Walking GRit is 509 ± 82, which means we think you are Competent to walk dogs”. When we have a computer generating the feedback, we should use any intelligence, artificial or otherwise, that is available. It is generally ok to start with the generic, “Ron, you total score is …” and “You did well on item clusters D and A, but were weak on cluster C,” and move on to things that are less obvious. I prefer to open with a positive, encouraging statement (clusters D and A), then mention problem areas (cluster C), and close with things to work on immediately (topics that haven’t been mastered but are close). Ideally, we would discuss the specifics of the surprising responses. This includes difficult items that were passed and easy items that were missed. This is moving into diagnosis from the model.
The more specifics, the better, even item statistics and foil analysis if anyone asks. But it would be much more valuable and much more work for both the item developers and systems analysts to provide a discussion of the type of misunderstandings or errors implied by any incorrect responses. It is work for the item developers because they would need to understand and explain why every distractor is there and what selecting it means. It is work for the system analysts because they need to keep track of and manage everything.
In today’s world, there is little reason to limit reporting to what can be squeezed onto an 8.5×11 sheet of paper or by concerns about the cost of color printing[6]. Paper copies are static, often cramped and overwhelming. Ideally, an electronic report, like an electronic test, will be interactive, dynamic, and engaging, with effective, targeted scaffolding. It should begin with the general overview and then allow the user to explore or be led through the interesting, important, and useful aspects of the responses, showing more and more detail as needed. Performance Level Descriptors and item clusters could be defined and displayed on request; item details could pop up when the plotting symbol is clicked.
This is not free; there will be resistance to giving items away because they are expensive and the item bank is sacred. Hopefully, we are moving away from once-a-year, high-stakes tests toward testing when it is helpful for the student, drawing from computer-generated and crowd-sourced item banks. And more importantly, toward immediate and informative feedback that might actually have some educational value.
[1] No, you didn’t pass, but if you test again with a parallel form, there is almost a 50% chance that you will.
[2] The little gray lines mark the performance levels (Competent, Skilled, and Master from left to right).
[3] Because GRits use three, rather than e, as their base, a difference of 100 GRits means 3 to 1 odds. Our hypothetical person has 3 to 1 odds of answering an item about leash tension but less than 1 to 3 odds for an item about tugging. More generally, a difference of 100k GRits means odds of 3k to 1. That’s friendlier than base e and odds like 2.71828…k to one.
[4] The report is (almost) number-free in the sense that the numbers are not needed to understand and use the results. It is not number-free in another sense because they are essential to provide the framework to create and arrange the display.
[5] This demonstration does not include tic marks for zero and perfect; in real life, you would probably have to account for them somehow. They tend to radically distort the scale without adding much, if any, information. They would extend the scale over 100 GRits in both directions and have probably ranges more than four times that in width.
[6] Someone will undoubtedly want a printer-friendly version to stick in the file cabinet because they have the file cabinet.

Not surprisingly, the graphics were generated using R. I have some code that does that I can email to anyone who leaves a comment. But don’t expect a complete, polished R-package.
LikeLike